The economy added 172,000 jobs in May. Here is what actually drove it.
70,000 of those jobs came from leisure and hospitality, a sector that averaged just 14,000 new positions per month over the prior year. The headline unemployment rate of 4.3% has barely moved since July 2025. And the figure published today will be revised by the next report, sometimes down, sometimes up by as much as 93,000, as this latest report shows.
Monthly employment data tells you where the market has been. Knowing where it is heading requires a different signal.
What fills that gap is real-time posting data. When JobMarketPulse data started rising at the start of the year, the BLS numbers were still reporting weaker figures. The May report revised those months upward, confirming what direct employer posting activity had already signaled weeks earlier. That is the value of tracking hiring intent in real time, and it is the lens through which the rest of this analysis is written.
The May numbers
According to the U.S. Bureau of Labor Statistics, total nonfarm payroll employment increased by 172,000 in May, and the unemployment rate held unchanged at 4.3%, a level that has now been within a narrow 4.3% to 4.5% band since July 2025. Markets noticed. Commentators called it steady. On balance, that is a reasonable read.
But understanding what drove the number matters. Of the 172,000 new payroll positions added in May, 70,000 came from leisure and hospitality, including restaurants, hotels, and entertainment venues, well above that sector’s 12-month average of just 14,000 per month. That is most likely a seasonal spike, not evidence the broader economy is accelerating. Local government accounted for another 55,000, largely non-education roles. Healthcare added 35,000, consistent with its steady recent trend. Financial services was the one clear soft spot, shedding 22,000 positions and now sitting 107,000 below its employment peak in May 2025.
Taken together, almost the entire month’s gain came from two categories: seasonal hospitality and government. The private sector outside healthcare added very little.
The headline unemployment rate does not capture the full picture. The labor force participation rate held at 61.8% in May, unchanged from April, and around 6.2 million people remain outside the labor force entirely but say they want a job. They are not counted as unemployed because they have stopped actively searching. Long-term unemployment, those jobless for 27 weeks or more, now represents 27.5% of all unemployed people, up 524,000 over the past year. The headline is improving. The edges of the market are moving more slowly.
Then there is the revision story, and this one reflects the need for real-time data. The May report revised March up 29,000 (to +214,000) and April up 64,000 (to +179,000), a combined +93,000. Those upward revisions align with what JobMarketPulse posting activity was already showing: an uptick in hiring intent at the start of the year that the BLS survey captured only after the fact. Monthly revisions are a built-in feature of survey-based data. The preliminary benchmark revisions of 818,000 and 911,000 in 2024 and 2025, respectively, the largest since 2009, illustrated just how wide that gap can be between the initial print and the eventual reality. Real-time posting data does not eliminate that uncertainty. It narrows it.
Job postings: 6.31 million. Stable year over year.
JobMarketPulse data show U.S. direct employer job postings at 6.31 million in May 2026, down from 6.46 million in April and essentially flat year-over-year with 6.35 million in May 2025, a difference of 0.6% that falls within normal seasonal variation. Postings pulled back from the March peak, as they typically do mid-year. The underlying trend is stable.
It is worth being precise about what these numbers measure. BLS employment figures count actual workers on payrolls. JobMarketPulse tracks active job postings on direct employer career sites, a measure of hiring intent, not hiring outcomes. Government openings data from JOLTS measures something different again: all unfilled positions across the economy, not just those actively advertised on employer sites, and it is derived from a monthly survey of businesses rather than observed posting activity. Each dataset has a different methodology. Right now, all three are pointing in roughly the same direction.
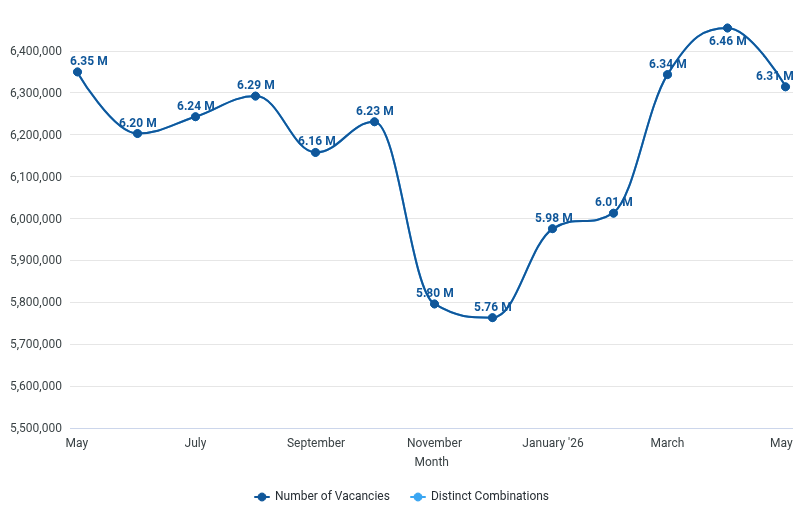
Figure 1: U.S. Monthly Vacancy Trend, last 12 months
The most recent April 2026 JOLTS release showed job openings surging to 7.6 million, up 731,000 from March and the highest level since May 2024. That is a meaningful signal of a return in employer demand. Hires dipped slightly in the same month to 5.1 million, a hires rate of 3.2%, suggesting employers are opening roles faster than they are filling them. That gap is worth monitoring, but it is not unusual in a market where hiring is becoming more selective. Professional and business services accounted for nearly all of the spike in openings.
The quits rate held at 1.9% in April and the layoff rate eased to 1.1%. Workers are staying put, employers are not cutting, and openings are rising. That combination is the most constructive labor market signal in several months. One month does not make a trend, but the direction is encouraging.
Not all markets are moving the same way
The national flat year-over-year figure conceals significant divergence at the state and category level. All figures below are sourced from JobMarketPulse May 2026 data.
On geography, the strongest state performers year-over-year include the District of Columbia (+5.9%), Wisconsin (+3.2%), Indiana (+2.4%), Vermont (+1.7%), and Arizona (+1.6%). The markets under most pressure are New Mexico (-7.6%), New Jersey (-6.6%), Oregon (-6.5%), Maine (-5.6%), and Illinois (-5.3%).
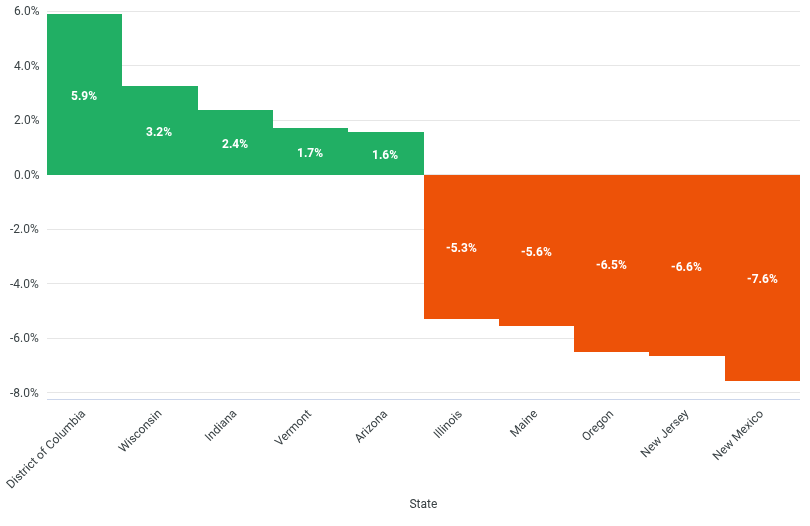
Figure 2: 10 biggest year-over-year percentage changes in job postings by state
Among major metros, Dallas leads with +5.1% year-over-year growth, at 170,378 postings. Washington, DC turned positive at +1.9%, and Phoenix gained +2.1%. The fastest-growing metros are San Jose (+11.2%), Huntsville (+10.3%), Madison (+9.1%), Dayton (+6.7%), and Raleigh (+5.7%). New York, Chicago, Boston, and Philadelphia are all modestly negative but tracking close to the national average.
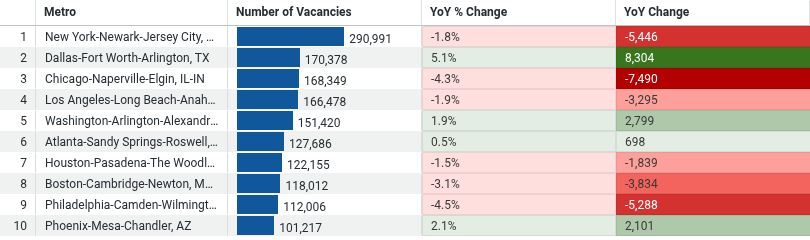
Figure 3: Top 10 biggest metros by job postings
Category-Level Trends
At the category level, Engineering leads all gainers at +15.9% year-over-year, followed by Information Technology at +12.9%, Warehouse at +9.3%, Veterinary at +9.0%, and Human Resources at +8.7%. The categories under most pressure are Insurance (-13.7%), Personal Service (-10.2%), Accounting (-7.9%), Sales (-6.6%), and Education (-6.0%).
The single most striking figure: AI Specialist postings surged +102.8% year-over-year to 12,497 postings, more than doubling in twelve months. Psychiatry fell 15.3%, and Social Work fell 17.5%. Two knowledge professions moving in opposite directions, both signaling where companies believe value is being created and where they believe it can be handled differently.
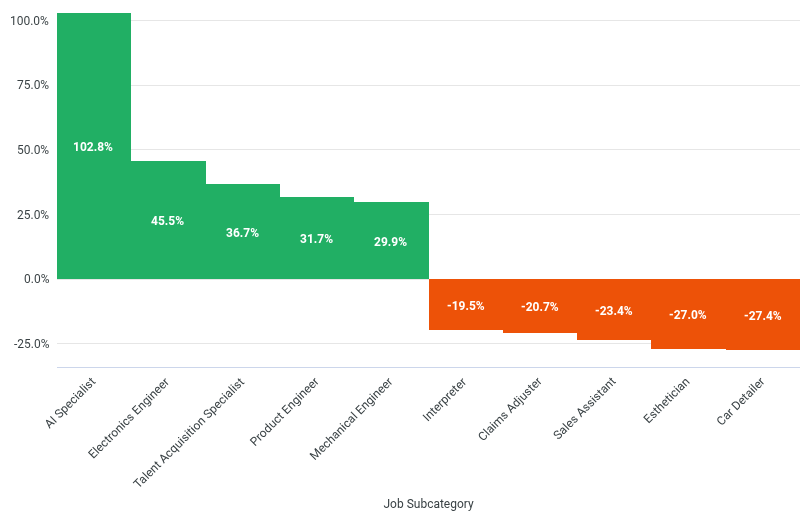
Figure 4: 10 biggest year-over-year percentage changes in job postings by subcategory
Recruitment agency postings stood at 1.28 million in May 2026, down 4.4% year-over-year, a steeper decline than the 0.6% seen among direct employers. Nursing and Healthcare together account for over 40% of all agency postings, underscoring the clinical sector’s continued reliance on staffing firms.
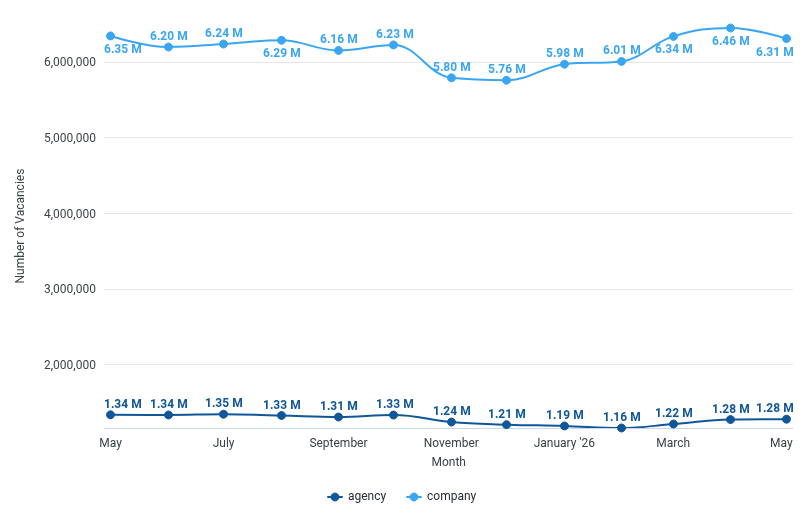
Figure 5: Company versus agency monthly job posting trend, last 12 months
Wages: nominal gains, real picture mixed
According to the May 2026 Employment Situation, average hourly earnings for private sector workers rose 0.3% in May to $37.53, up 3.4% year-over-year. The most recent CPI data from April 2026 shows prices rising 3.8% year-over-year, meaning nominal wage growth is running slightly behind inflation. The BLS Real Earnings report for April confirmed real average hourly earnings fell 0.2% year-over-year. In aggregate, purchasing power is essentially flat.
The picture by role, drawn from the JobMarketPulse Q1 2026 Report, is more varied. Trades roles led in advertised wage growth: electricians posted an 8.7% increase annually, and production workers gained 3.6% annually. Software developers rose 4.7%, and project managers gained the same. Skilled technical roles are still commanding real wage growth even as the broader market levels out.
Customer service representative postings surged +18.6% year-over-year in volume, yet advertised wages fell 3.9%, from $20.00 per hour to $19.23. More postings, lower pay. That tells you something about how employers are repositioning those roles.
Remote postings pulled back in May after a strong Q1. JobMarketPulse data shows 235,400 remote postings in May 2026, up 10.4% year-over-year but down 6.4% from April’s peak, continuing a retreat from the March high of 252,900. Remote roles now represent approximately 3.7% of all active postings. Demand remains concentrated in Insurance (20.9%), Information Technology (18.6%), Marketing (13.5%), Real Estate (12.3%), and Business Services (12.2%).
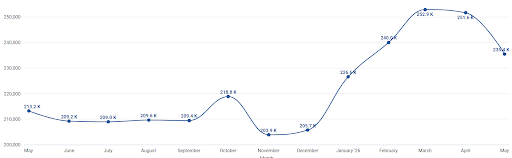
Figure 6: Remote job postings monthly trend, last 12 months
What this means for hiring and compensation decisions
May 2026 is, on balance, a positive data month. BLS, JOLTS, and JobMarketPulse are telling a broadly consistent story: the labor market is holding, employer demand is ticking up, and the data available in real time ahead of this report already pointed in this direction.
For HR leaders and compensation teams, the sector split remains the most actionable signal. Engineering, IT, warehouse, and infrastructure talent remain in a competitive posting environment, and wages reflect it. Sales, education, accounting, and administrative functions are softer, and advertised wages in those categories are feeling it.
The broader point is about timing. When JobMarketPulse posting data started rising at the start of the year, BLS was still reporting weaker numbers. The May report revised those months upward, confirming what the real-time data had already shown. Posting intent leads hiring outcomes. Hiring outcomes lead the official employment count. For any organization making workforce or compensation decisions, the signal is available weeks before the government prints it. Decision-makers who wait for official confirmation are always working from yesterday’s market.
See this data in action
Explore structured job data and labor market intelligence for your use case.